Share this article
The stock market has been supported by a healthier-than-expected economy this year, generating returns that have helped many portfolios to partially recover from last year's bear market. Investors now hope these growth trends will translate into stronger corporate earnings since, in the long run, markets tend to follow the same trajectory as profits. With the future of the economy still uncertain, what signs are there that companies might begin to see improved profitability?
Earnings Growth May Have Reached An Inflection Point
The third quarter earnings season is wrapping up with 94% of S&P 500 companies reporting their results. According to FactSet, 82% of these companies have had positive earnings surprises, yielding an expected year-over-year earnings-per-share growth rate of 4.3%. This is likely to be the first quarter of positive growth in a year, a notable inflection point that mirrors the surprising stability of the underlying economy. Consensus Wall Street estimates are for earnings to be flat this year at about $217 per share but to then rebound in 2024 by 11%. While this is somewhat at odds with economic forecasts for slowing growth in the coming quarters, it's safe to say that any acceleration in earnings would be welcomed by investors.
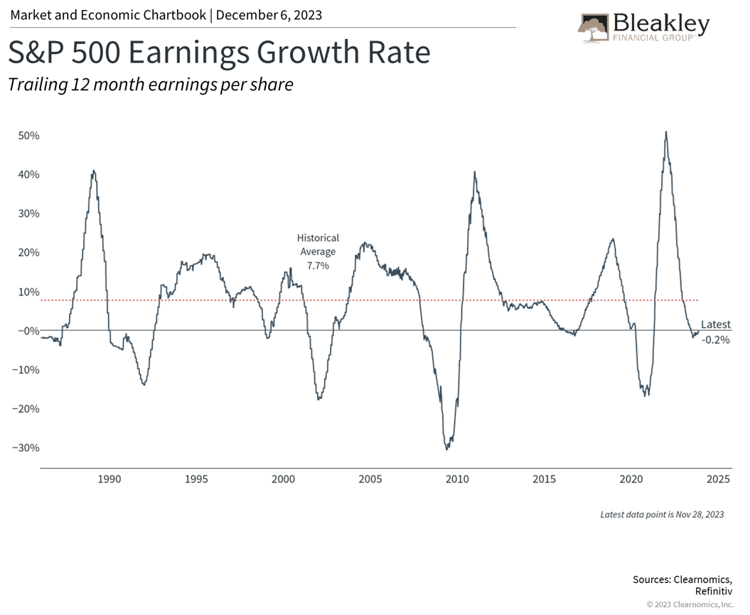
As the accompanying chart shows, the growth of corporate profits has been slowing since its peak in 2021, but may have reached a turning point. Historically, large public companies have increased their earnings by an average of 7.7% per year, but this fluctuates alongside the business cycle. To oversimplify the earnings cycle, in good times companies increase their sales faster than their expenses, boosting profits and margins. In bad times, companies experience slowing revenues and cut costs to maintain margins. Better cost structures then allow companies to be more profitable once the economy turns around.
It may seem obvious that profits matter and that, over long time frames, they should reflect the value created by companies. Business owners, executives, and corporate boards have strong incentives to maintain and boost profitability and thus shareholder returns. When it comes to investing, there are three specific reasons why this matters to investors.
The Stock Market Tends To Follow Corporate Earnings
First, the stock market tends to follow corporate earnings in the long run. The accompanying chart shows that while the price and earnings of the S&P 500 do not line up perfectly, they follow the same broad trends. This is because economic growth boosts earnings which in turn pushes stock prices higher. So, while the economy and the stock market are not one and the same, the two are closely related through the performance of companies.
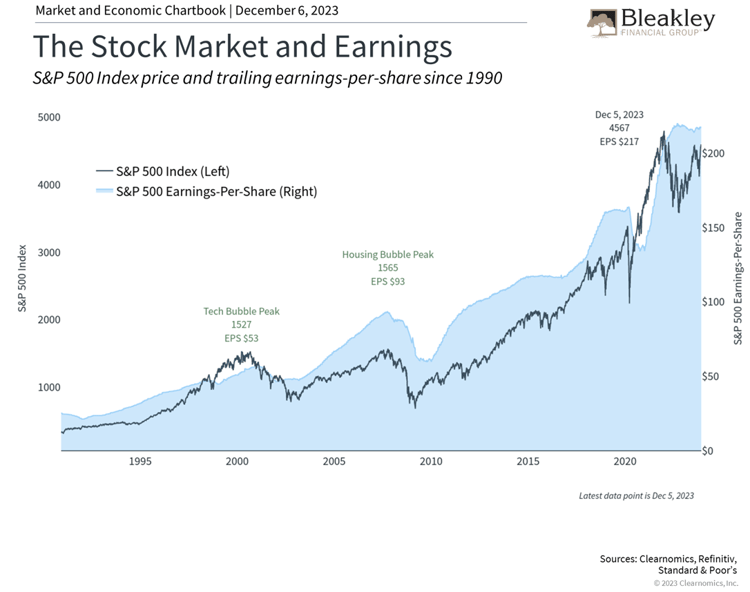 Second, whether the stock market is "cheap" or "expensive" depends not just on stock prices but also on corporate performance, the most important of which is arguably earnings. The price-to-earnings ratio, for instance, is simply the price of a stock or index divided by some earnings measure, such as expected earnings over the next twelve months.
What this means is that even if prices don't change, increasing earnings will make the market more attractive, and vice versa. The current S&P 500 price-to-earnings ratio is 18.7 times next-twelve-month earnings, above the historical average of 15.6 but still well below the 2020 peak of around 23. If earnings growth does begin to accelerate, this measure could improve further.
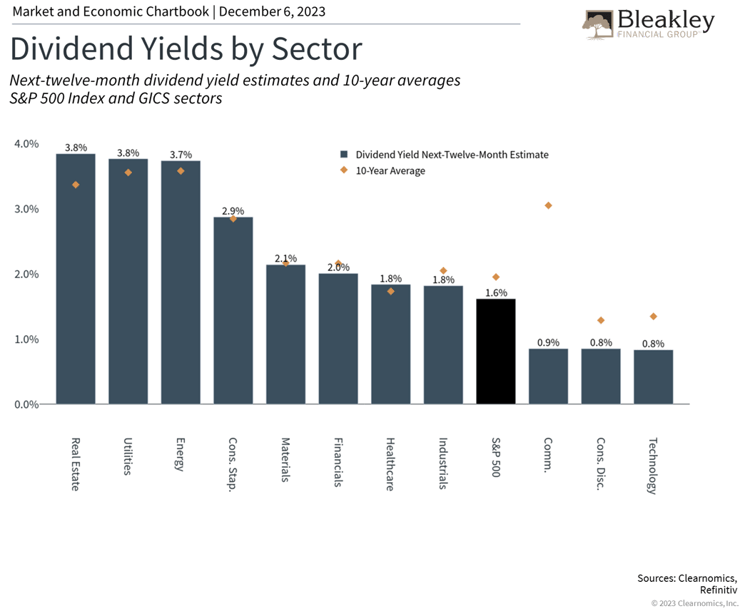
Dividends Are An Important Consideration For All Investors
Third, profits support dividend payments. From a corporation's perspective, dividends are a way to return cash to shareholders. In theory, if a corporation has no attractive investment opportunities, it makes sense to return cash to shareholders who can invest it themselves. In general, however, corporations pay steady dividends in order to attract investors, especially if they can grow these payments over time. Additionally, some companies have been holding on to more and more cash and some sectors pay relatively low dividends, especially across technology-related companies.
 For investors, dividends are an integral part of total returns. Historically, dividends - and not price appreciation - were one of the primary reasons for investing. Today, everyday investors seem to focus mostly on stock prices except in cases where portfolio income is needed, such as for those nearing or in retirement.
While bond yields have risen this year and the market has been volatile, the accompanying chart shows that many sectors still have very attractive dividend yields. Not surprisingly, sectors that have underperformed this year, including Real Estate, Utilities, and Energy, can generate yields just under 4%. Sectors that have seen the most price appreciation, namely Communication Services, Consumer Discretionary, and Information Technology, also have the lowest yields. Thus, investors should not focus exclusively on recent performance or dividend yields. Instead, it's important to diversify across sectors in order to benefit from all phases of the market cycle, especially if earnings do continue to turn around.
The bottom line? Economic growth drives corporate earnings which in turn support the stock market. Investors should follow these longer-term trends, rather than day-to-day market movements, as they work toward their financial goals.
Disclaimer
The opinions voiced in this material are for general information only and are not intended to provide specific advice or recommendations for any individual. The market and economic data is historical and is no guarantee of future results. All indices are unmanaged and may not be invested into directly. The information in this report has been prepared from data believed to be reliable, but no representation is being made as to its accuracy and completeness.
This commentary is for informational purposes only and is not meant to constitute a recommendation of any particular investment, security, portfolio of securities, transaction or investment strategy. No chart, graph, or other figure provided should be used to determine which securities to buy, sell or hold. No representation is made concerning the appropriateness of any particular investment, security, portfolio of securities, transaction or investment strategy. You should speak with your own financial professional before making any investment decisions.
Past performance is not indicative of future results. Bleakley Financial Group, LLC does not guarantee any specific outcome or profit. These disclosures cannot and do not list every conceivable factor that may affect the results of any investment or investment strategy. Risks will arise, and an investor must be willing and able to accept those risks, including the loss of principal.
Certain statements contained herein are statements of future expectations and other forward looking statements that are based on opinions and assumptions that involve known and unknown risks and uncertainties that would cause actual results, performance or events to differ materially from those expressed or implied in such statements.
The economic forecasts set forth in this material may not develop as predicted and there can be no guarantee that strategies promoted will be successful. The fast price swings in commodities and currencies will result in significant volatility in an investor’s holdings. International investing involves special risks such as currency fluctuation and political instability and may not be suitable for all investors. These risks are often heightened for investments in emerging markets. The fast price swings in commodities and currencies will result in significant volatility in an investor’s holdings.
Copyright (c) 2023 Clearnomics, Inc. All rights reserved. The information contained herein has been obtained from sources believed to be reliable, but is not necessarily complete and its accuracy cannot be guaranteed. No representation or warranty, express or implied, is made as to the fairness, accuracy, completeness, or correctness of the information and opinions contained herein. The views and the other information provided are subject to change without notice. All reports posted on or via www.clearnomics.com or any affiliated websites, applications, or services are issued without regard to the specific investment objectives, financial situation, or particular needs of any specific recipient and are not to be construed as a solicitation or an offer to buy or sell any securities or related financial instruments. Past performance is not necessarily a guide to future results. Company fundamentals and earnings may be mentioned occasionally, but should not be construed as a recommendation to buy, sell, or hold the company's stock. Predictions, forecasts, and estimates for any and all markets should not be construed as recommendations to buy, sell, or hold any security--including mutual funds, futures contracts, and exchange traded funds, or any similar instruments. The text, images, and other materials contained or displayed in this report are proprietary to Clearnomics, Inc. and constitute valuable intellectual property. All unauthorized reproduction or other use of material from Clearnomics, Inc. shall be deemed willful infringement(s) of this copyright and other proprietary and intellectual property rights, including but not limited to, rights of privacy. Clearnomics, Inc. expressly reserves all rights in connection with its intellectual property, including without limitation the right to block the transfer of its products and services and/or to track usage thereof, through electronic tracking technology, and all other lawful means, now known or hereafter devised. Clearnomics, Inc. reserves the right, without further notice, to pursue to the fullest extent allowed by the law any and all criminal and civil remedies for the violation of its rights.
Approval #521588
About the Author