Share this article
2024 began with debates over a “soft” versus “hard” landing as the Fed attempted to stabilize the economy as well as over the sustainability of last year’s market rally. Only three months later, those concerns have given way to a calmer environment centered around fading inflation and the Fed’s plans for reducing interest rates. This has resulted in a strong market rally with the S&P 500 index, Dow Jones Industrial Average, and Nasdaq gaining 10.2%, 5.6%, and 9.1% year-to-date, respectively.
The economic environment has surprised many investors as inflation continues to fade. The Fed’s preferred measure of inflation, the Personal Consumption Expenditures index, rose 2.5% on a year-over-year basis for all prices and 2.8% when excluding food and energy, both significant improvements from their peaks only a year and a half ago. While some areas of inflation such as shelter and energy costs remain problematic, inflation is steadily moving back to the Fed’s long-term 2% target.
Meanwhile, unemployment is still under 4% despite layoffs in the tech sector, interest rates have been more stable with the 10-year Treasury yield around 4.2%, and stock market returns have broadened beyond artificial intelligence stocks. Despite these positive trends, some investors are concerned about the upcoming presidential election and the next phase of Fed policy. These worries are only amplified by the fact that the market is hovering near all-time highs.
In uncertain market environments, it’s more important than ever for investors to maintain a long-term perspective. Below are three key insights for understanding upcoming events and how they have historically affected investors.
1. Steady Economic Growth Has Driven Markets to New All-Time Highs
The S&P 500 has achieved 20 new all-time highs so far this year despite the brief market pullback during the first two weeks of the year. While this is positive for investors, it is easy to worry that continued market growth may not be sustainable. Do new all-time highs mean that the market is due for a pullback?
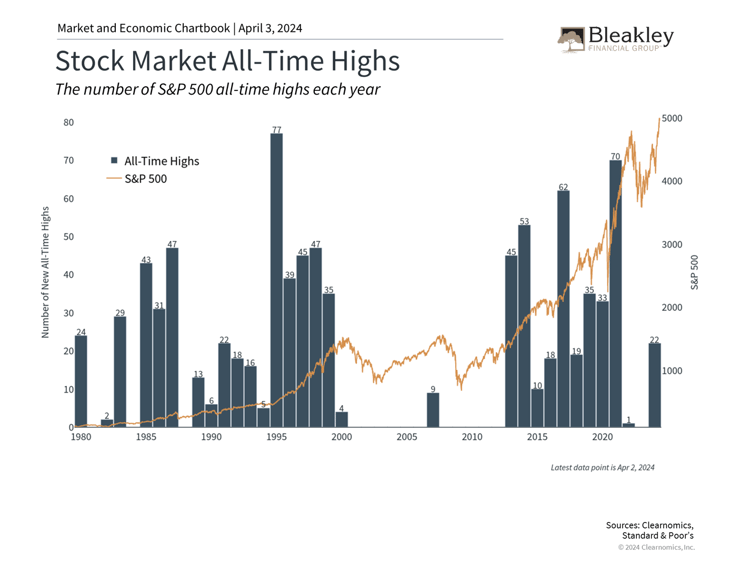
While price swings are an unavoidable part of investing, and the market does experience pullbacks from time to time, history shows that markets also tend to rise over long periods. During a bull market cycle, major stock market indices will naturally spend a significant amount of time near record levels, as shown in the accompanying chart. For instance, 2021 experienced 70 days with the market closing at new all-time highs, adding to the hundreds that were achieved since 2013.
Taking a long-term perspective allows investors to benefit from these market trends without constantly worrying about when a pullback might occur. Holding an appropriately diversified portfolio can help investors to withstand market pullbacks without focusing too much on the exact level of the market.
2. Markets Have Rallied Through Both Democratic and Republican Presidencies
Coverage of the presidential election is heating up ahead of the November rematch between Presidents Biden and Trump. While elections are an important way for Americans to help shape the direction of the country as citizens, voters and taxpayers, it’s important to vote at the ballot box and not with investment portfolios.
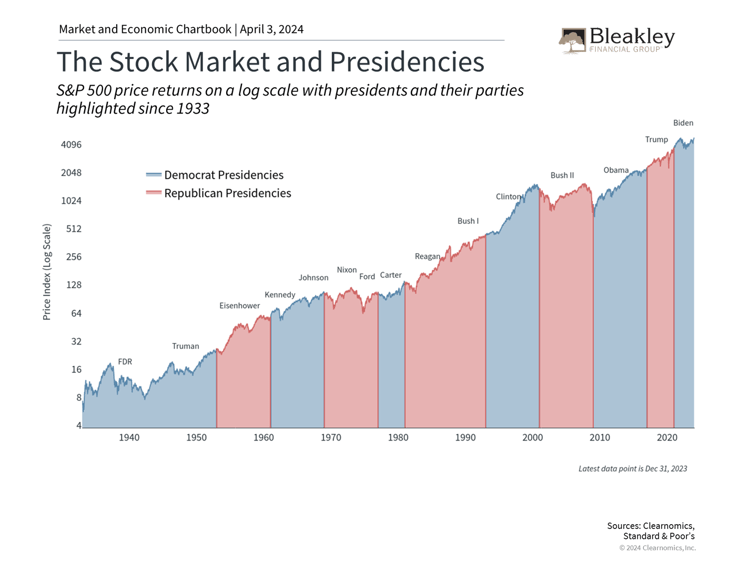
This is because history shows that markets can perform well under both Democrats and Republicans. As the accompanying chart shows, the economy and stock market have grown over decades regardless of who was in the White House. What mattered more across these periods were the ups and downs of the business cycle. The Clinton years, for instance, benefited greatly from the long expansion of the 1990s. The George W. Bush years, on the other hand, overlapped with both the dot-com crash and the 2008 global financial crisis. Business and market cycles defined their presidencies, and not the other way around.
Of course, politics can impact taxes, trade, industrial activity, regulations, and more. However, not only do these policy changes tend to be incremental, but also the exact timing and effects are often overestimated. Thus, it’s important to focus less on day-to-day election poll results and more on the long-term economic and market trends. Ideally, investors concerned about the impact of specific policies on their financial plans should speak with a trusted financial advisor.
3. The Fed Is Expected to Cut Rates as Inflation Stabilizes
The market rally broadened beyond mega-cap technology stocks in the first quarter. The equal weight S&P 500, an alternative to the standard market cap-weighted index, hit a new all-time high in early March, a sign that a wider range of stocks is performing well. The positive economic outlook and the possibility of rate cuts have boosted optimism across many parts of the market.
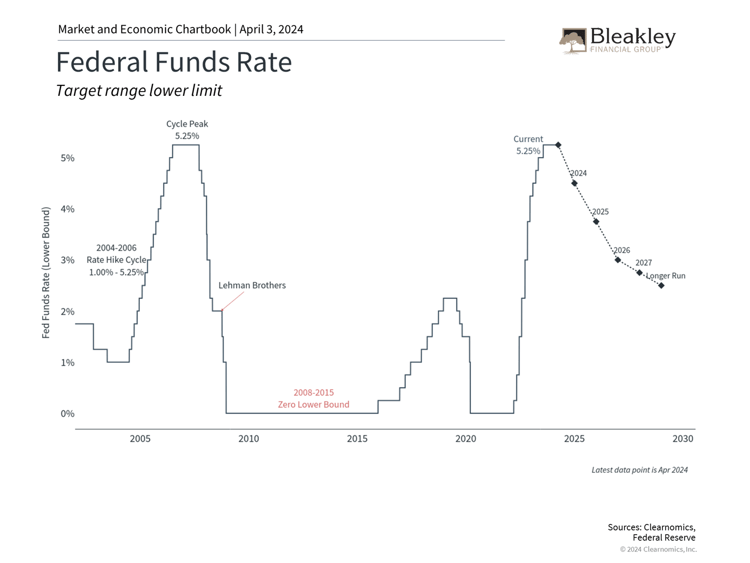
Given this backdrop, the Fed is expected to cut rates later this year although the timing remains uncertain. The accompanying chart shows the possible path of the federal funds rate based on the Fed’s latest projections, including three cuts this year. At its last meeting, the Fed cited strong job gains and low unemployment as indicators of solid economic activity but emphasized that “the Committee does not expect it will be appropriate to reduce [interest rates] until it has gained greater confidence that inflation is moving sustainably toward 2 percent.”
Regardless of the exact timing and path of Fed rate cuts, these projections represent a reversal of the emergency monetary policy actions that began in early 2022. For investors, it’s important to adapt to this changing environment and not focus solely on the events of the past few years.
The bottom line? With markets near all-time highs, a presidential election approaching, and Fed rate cuts expected to begin later this year, investors should stick to their financial plans while staying invested in the second quarter of the year. History shows that this is still the appropriate way to pursue long-term financial goals.
Disclaimer
The opinions voiced in this material are for general information only and are not intended to provide specific advice or recommendations for any individual. The market and economic data is historical and is no guarantee of future results. All indices are unmanaged and may not be invested into directly. The information in this report has been prepared from data believed to be reliable, but no representation is being made as to its accuracy and completeness.
There is no guarantee that a diversified portfolio will enhance overall returns or outperform a non-diversified portfolio. Diversification does not protect against market risk.
This commentary is for informational purposes only and is not meant to constitute a recommendation of any particular investment, security, portfolio of securities, transaction or investment strategy. No chart, graph, or other figure provided should be used to determine which securities to buy, sell or hold. No representation is made concerning the appropriateness of any particular investment, security, portfolio of securities, transaction or investment strategy. You should speak with your own financial professional before making any investment decisions.
Past performance is not indicative of future results. Bleakley Financial Group, LLC does not guarantee any specific outcome or profit. These disclosures cannot and do not list every conceivable factor that may affect the results of any investment or investment strategy. Risks will arise, and an investor must be willing and able to accept those risks, including the loss of principal.
Certain statements contained herein are statements of future expectations and other forward looking statements that are based on opinions and assumptions that involve known and unknown risks and uncertainties that would cause actual results, performance or events to differ materially from those expressed or implied in such statements.
The economic forecasts set forth in this material may not develop as predicted and there can be no guarantee that strategies promoted will be successful. The fast price swings in commodities and currencies will result in significant volatility in an investor’s holdings. International investing involves special risks such as currency fluctuation and political instability and may not be suitable for all investors. These risks are often heightened for investments in emerging markets. The fast price swings in commodities and currencies will result in significant volatility in an investor’s holdings.
Advisors associated with Bleakley Financial Group may be: (1) registered representatives with, and securities offered through LPL Financial, Member FINRA/SIPC, (2) registered representatives with, and securities offered through LPL Financial, Member FINRA/SIPC and investment advisor representatives of Bleakley Financial Group; or (3) solely investment advisor representatives of Bleakley Financial Group, and not affiliated with LPL Financial. Investment advice offered through Bleakley Financial Group, a registered investment advisor and separate entity from LPL Financial.
Copyright (c) 2024 Clearnomics, Inc. All rights reserved. The information contained herein has been obtained from sources believed to be reliable, but is not necessarily complete and its accuracy cannot be guaranteed. No representation or warranty, express or implied, is made as to the fairness, accuracy, completeness, or correctness of the information and opinions contained herein. The views and the other information provided are subject to change without notice. All reports posted on or via www.clearnomics.com or any affiliated websites, applications, or services are issued without regard to the specific investment objectives, financial situation, or particular needs of any specific recipient and are not to be construed as a solicitation or an offer to buy or sell any securities or related financial instruments. Past performance is not necessarily a guide to future results. Company fundamentals and earnings may be mentioned occasionally, but should not be construed as a recommendation to buy, sell, or hold the company's stock. Predictions, forecasts, and estimates for any and all markets should not be construed as recommendations to buy, sell, or hold any security--including mutual funds, futures contracts, and exchange traded funds, or any similar instruments. The text, images, and other materials contained or displayed in this report are proprietary to Clearnomics, Inc. and constitute valuable intellectual property. All unauthorized reproduction or other use of material from Clearnomics, Inc. shall be deemed willful infringement(s) of this copyright and other proprietary and intellectual property rights, including but not limited to, rights of privacy. Clearnomics, Inc. expressly reserves all rights in connection with its intellectual property, including without limitation the right to block the transfer of its products and services and/or to track usage thereof, through electronic tracking technology, and all other lawful means, now known or hereafter devised. Clearnomics, Inc. reserves the right, without further notice, to pursue to the fullest extent allowed by the law any and all criminal and civil remedies for the violation of its rights.
Approval #561825
About the Author